Technical Report
Connecting the Dots: Persistent Accent Gaps in Speech Recognition



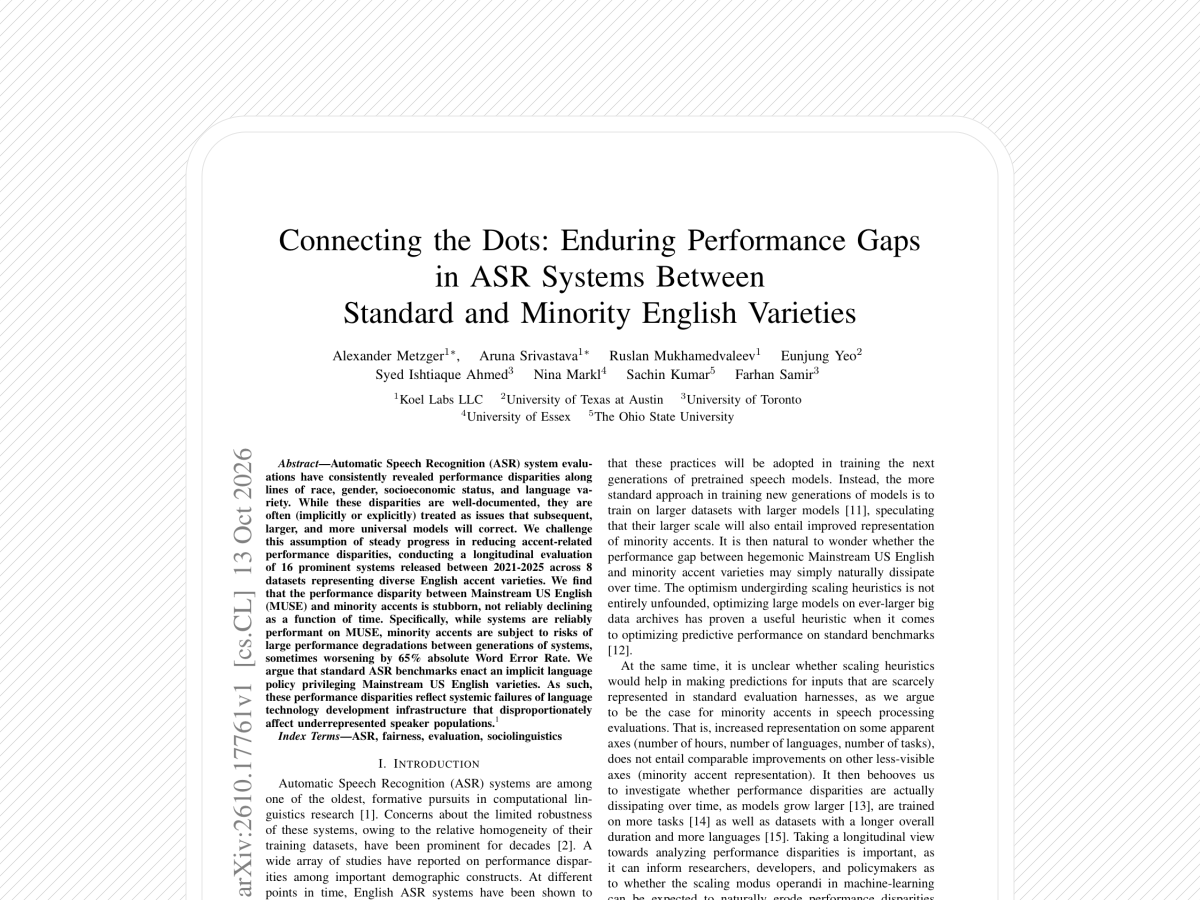
Automatic speech recognition (ASR) turns speech into written words. It powers captions, voice interfaces, and transcription tools. When it works well for one accent but poorly for another, access to those tools depends on how someone speaks.
It is tempting to assume that larger models and more training data will gradually close these gaps. Our IEEE SLT 2026 paper, Connecting the Dots, tests that assumption across 16 systems released from 2021 to 2025. Across eight evaluations, we find that accent gaps do not reliably shrink over time. Selected minority accents also face larger setbacks when a later system performs worse than an earlier one.
Following the gap across four years
A benchmark is a shared test used to compare models. A model can perform well on that test while struggling with speech the test barely represents. We therefore evaluate systems on four multi-accent speech collections, divided into eight tasks, rather than relying on a single overall score.
| Speech collection | Evaluations |
|---|---|
| Speech Accent Archive | One shared reading passage |
| L2-Arctic | Read speech and spontaneous speech |
| OpenSLR-83 | English varieties from the British Isles |
| ALLSTAR | The Little Prince, Human Rights, and two Hearing in Noise Test (HINT) sentence lists |
We measure word error rate (WER): the number of substituted, missing, or added words, divided by the number of words in the reference transcript. Lower is better. Ten errors against a 100-word reference give a WER of 10%.
For each evaluation, we track the difference between the paper's selected minority accent and a standard-accent control. The control is Mainstream US English (MUSE), except in OpenSLR-83, where it is Southern British English. The comparison accent stays fixed across models. Here, “minority” refers to varieties underrepresented in mainstream ASR evaluation.
The gap appears in every evaluation
Averaged across the 16 systems, the gaps range from about 9 to 26 percentage points. A percentage-point gap is an absolute difference: 20% WER versus 5% WER is a 15-point gap.
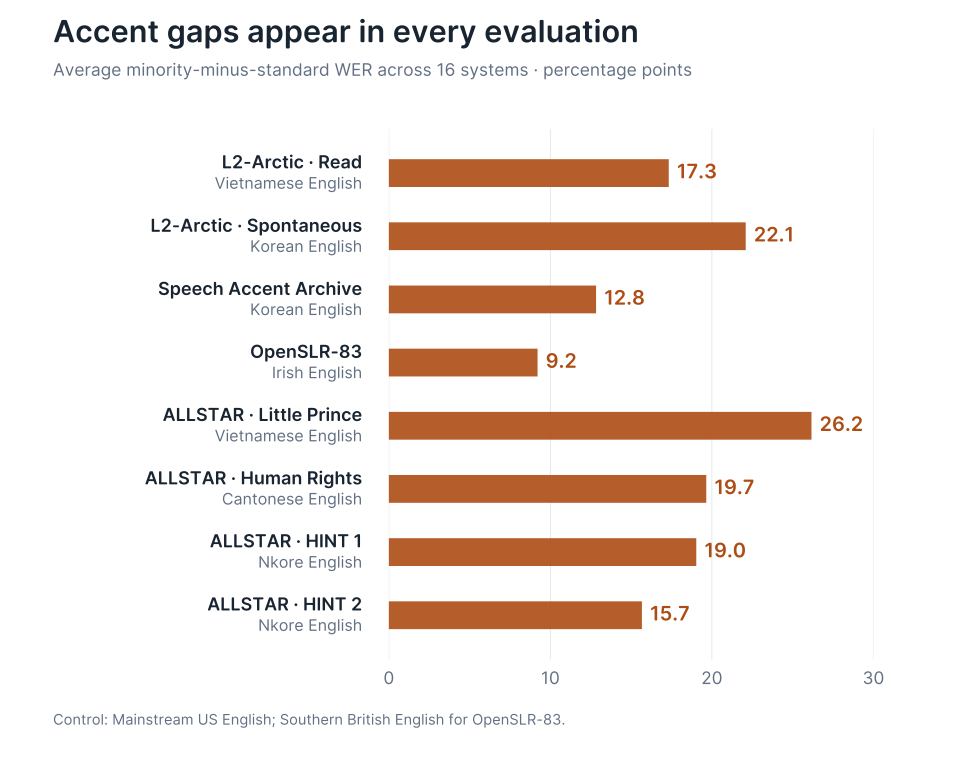
Reading a same passage, recalling a story, and speaking spontaneously place different demands on a recognizer, so the datasets are not interchangeable measures of an accent's difficulty. Yet the common pattern is a persistent gap between minority accent and mainstream accent model performance.
Some gaps narrow, but progress can reverse
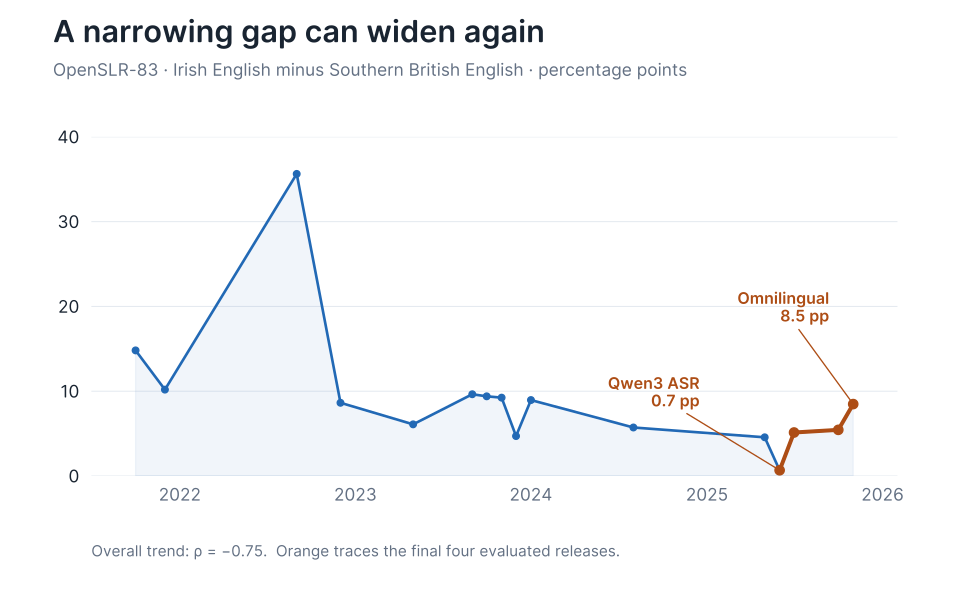
Looking at release dates, we find statistically significant evidence of a narrowing gap in only two of the eight evaluations: read L2-Arctic and OpenSLR-83. Their Spearman correlations are −0.60 and −0.75, respectively, with p < 0.05. A negative correlation means later systems tend to have smaller gaps. The other six do not provide significant evidence of a downward trend.
Even OpenSLR-83's encouraging overall trend contains a reversal. The Irish–Southern British English gap falls to about 0.7 points at Qwen3 ASR, then rises across the final three releases to about 8.5 points at Omnilingual. Progress over several years does not guarantee that the next available system will preserve it.
A later system can perform much worse
A regression is an increase in errors relative to an earlier system. One striking example comes from ALLSTAR's second Hearing in Noise Test (HINT) sentence list. For Nkore-influenced English, mean WER rises from about 7.0% with Whisper large-v2 to 71.7% with MMS 1B: an increase of roughly 65 percentage points. The corresponding increase for MUSE is about 5.3 points.
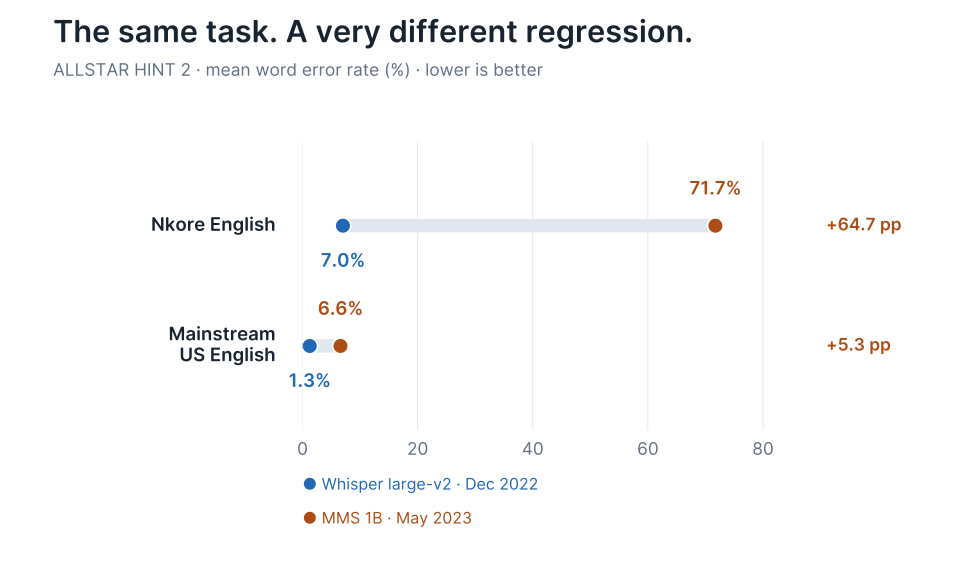
This is a large individual regression, not the typical result of every release. To understand whether the pattern extends beyond one example, we need to measure setbacks across the whole series.
Who bears the larger setbacks?
We compare every chronologically ordered pair of systems, keep the pairs where WER increases, and average the size of those increases. We call this mean degradation (MD). It measures how severe the setbacks are when they occur, rather than how likely a new release is to perform worse. The pairs include non-adjacent releases.
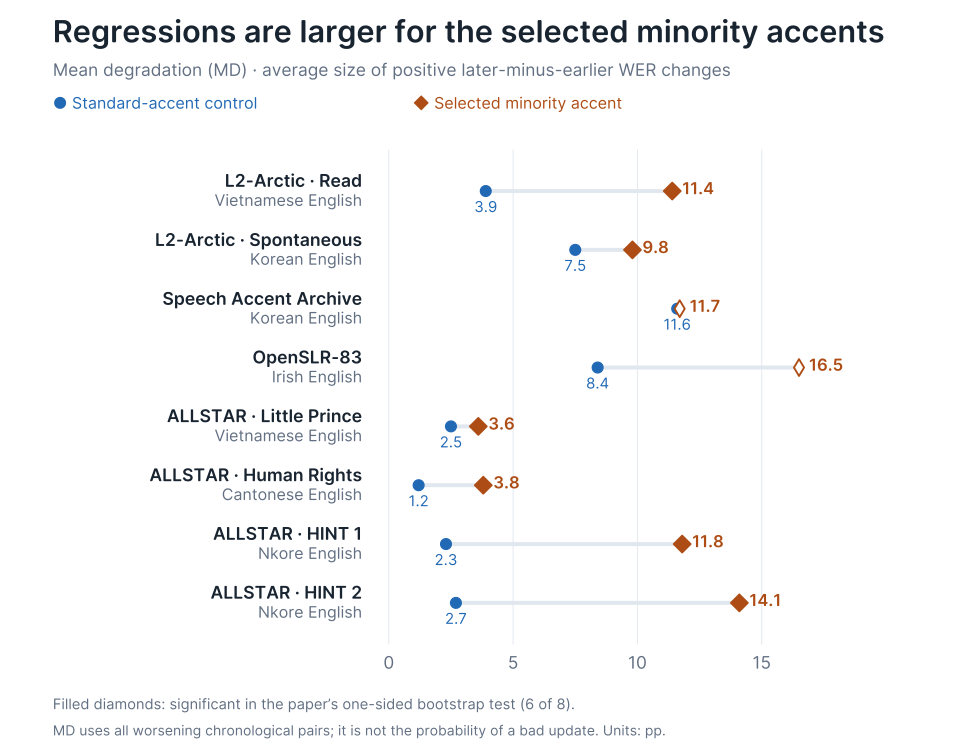
All eight point estimates are higher for the selected minority accent, and six differences are statistically significant. On ALLSTAR HINT 2, MD is 14.1 points for Nkore English versus 2.7 for MUSE.
Whose speech do the benchmarks make visible?
We also audit the evaluation datasets listed in the systems' technical reports. Of 61 model–dataset evaluations, only 12 explicitly consider accent diversity. Repeated uses of a benchmark count separately. Among 24 distinct benchmark families, seven explicitly consider multiple English varieties.
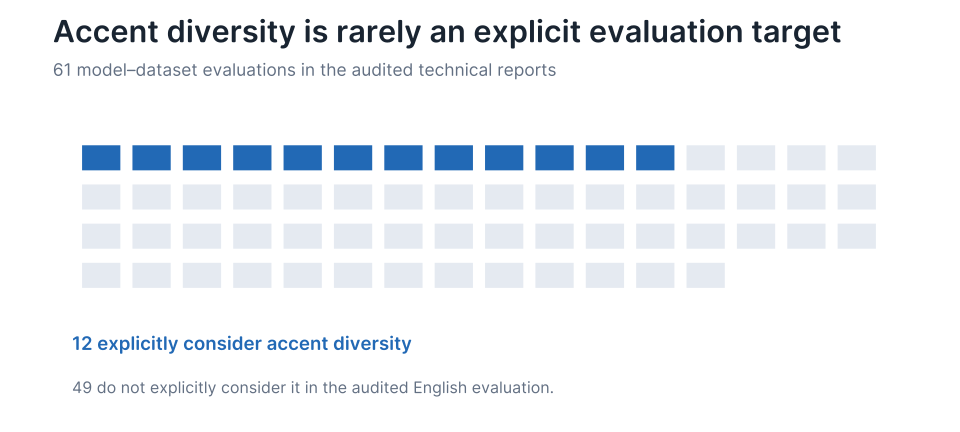
Mainstream US English appears throughout this evaluation infrastructure, often across several speaking styles and settings. Other English varieties receive more sporadic attention. Supporting more languages or collecting more hours of speech does not, by itself, tell us whether the full range of English accents is represented.
We argue that these benchmark choices act as an implicit language policy: they help determine whose errors are visible and whose improvements count as progress. The longitudinal results are consistent with that concern. A necessary step towards addressing the accent gap and regressions is thus for model developers to incorporate more inclusive dialect-stratified evaluations of their systems.
What the study can and cannot tell us
This is a comparison of 16 systems from different teams, with different architectures, training data, and development goals. It is not a controlled experiment on model size or training-data volume, and it cannot identify which training decision caused a gap. The results describe the evaluated releases and speech collections, not every speaker or every ASR system available today.
The eight evaluations also come from four corpora, so they are not eight independent samples of the world's English. Our fixed comparison groups make the timeline interpretable, but do not describe every accent in each collection. WER measures transcription errors; it does not capture the full practical cost of being misunderstood.
Measure progress for the speakers who use the system
The practical implication is to evaluate each release across accents and speaking situations, report those results separately, and check for regressions before replacing an existing system. A better average score is useful evidence, but it cannot establish that a new model works better for every community.
Larger speech models can improve recognition. Our results show why inclusive speech technology also needs sustained attention to who appears in training and evaluation, and whether improvements survive the next release.
How this informs our practices at Koel Labs
At Koel Labs, these findings motivate us to choose evaluation data deliberately and examine performance across speaker groups. An overall score is most useful when we can also see whose speech the model handles well and where it struggles.
Our leaderboard blog describes how we apply this to phonetic transcription, which records individual speech sounds. We evaluate models on the same test set, with 100 clips from each of five datasets covering native English speech, several non-native accents, and post-stroke aphasia. Equal sampling prevents the largest corpus from dominating the overall score; dataset-specific results help reveal differences that the average can hide.
Paper authors: Alexander Metzger, Aruna Srivastava, Ruslan Mukhamedvaleev, Eunjung Yeo, Syed Ishtiaque Ahmed, Nina Markl, Sachin Kumar, and Farhan Samir. Read the full paper and appendix for all accent groups, results, and references.